![]()
Prevention, crisis and post-crisis response:
a three-sided problem
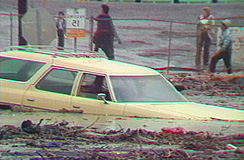 |
The impacts of floods, forest fires, earthquakes and other natural disasters around the globe in recent years are forcing us to seek new prevention and mitigation methods. This task involves developing predictive models and monitoring tools, drawing up regulatory requirements and planning emergency response. |
For this purpose, we need to acquire regularly updated, reliable and objective spatially referenced information in timely fashion.

The only way to prevent flooding is through effective land-use planning and
a detailed knowledge of land occupancy and the natural phenomena likely to
affect a region. In this respect, high- and very-high-resolution Earth observation
data are a valuable aid for producing and maintaining maps to provide information
about flood-prone areas.
Understanding the phenomenon
SPOT 5 has the potential to improve our understanding of land use, land cover
and flood extents. Investigations covering an area of the Ried central d'Alsace,
a marshy floodplain in north-east France, used SPOT 5 data to identify natural
and man-made features that have helped to stem historical floods. These include:
- mounds, levees and embankments,
- secondary roads and dirt tracks,
- ditches, hedgerows and slopes,
- parcel boundaries and field borders.
![]() Man-made
and natural features limiting flood extent in the Erbesmunster region of the
lower Rhine valley, France.
Man-made
and natural features limiting flood extent in the Erbesmunster region of the
lower Rhine valley, France.
Assisting risk prevention planning
SPOT 5 2.5-metre black-and-white data, which allow analysis at a scale of
1:5 000, are a cost-effective solution that usefully complements traditional
surveying methods relying on aerial photography.
At this scale, SPOT 5 data can be combined with cadastral maps for flood risk
prevention planning. Flood prevention plans define parcel-level guidelines
that serve as a basis for establishing regulatory land-use provisions and
awarding building permits.

Optical and radar satellite imagery has already shown its potential for detecting
damage caused by natural disasters. However, earthquake damage chiefly affects
buildings and until now it has proven impossible to interpret damage zones
in sufficient detail with the level of spatial resolution currently available
for civil applications. SPOT 5's improved resolution and capabilities will
make it possible to map earthquake damage quickly.
Supporting emergency response
On the morning of 26 January 2001, an earthquake registering 7.7 on the Richter
Scale hit the region of Kachchh in Gujarat, north-west India. The United States
Geographical Survey located the epicentre of the tremor, the most destructive
in India for 50 years, some 20 kilometres north-east of the town of Bhuj.
Investigations were conducted in this region to demonstrate how SPOT 5 data can assist emergency management and disaster response teams in urban areas. This project aimed to map urban zones affected by the earthquake by comparing two satellite images-one acquired before and one immediately after the event-within less than 48 hours of image reception and with little or no additional information to aid interpretation.
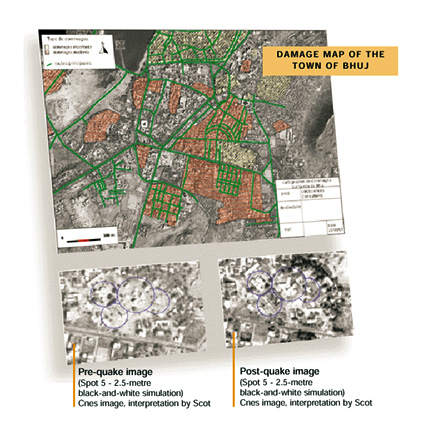
The method is based on locating damage by automatic processing, followed by
a vital photointerpretation step. Results show that SPOT 5 is able to detect
changes to large buildings and determine the probability that they have been
damaged.
Automatic processing significantly speeds up photointerpretation and ensures
that it is exhaustive. For a region such as Bhuj, covering 112 square kilometres,
a single operator can complete photointerpretation within 48 hours.
|
The advantages of SPOT 5 for natural disaster management HRG instrument (High Resolution Geometric)
HRS instrument (High Resolution Stereoscopic)
|
References
- SPOT 5 Preparatory Programme: Evaluation of simulated SPOT 5 data for flood risk prevention planning - SERTIT.
- ADEMA Programme: Benefits of SPOT 5 data for assessing and mapping earthquake damage in urban areas - Scot.
- ADEMA Programme: Damage assessment and mapping using SPOT 5 imagery: simulation for the earthquake in the town of Bhuj, Gujarat, India, 26 January 2001) - Géosciences Consultants