
Mapping storm damage
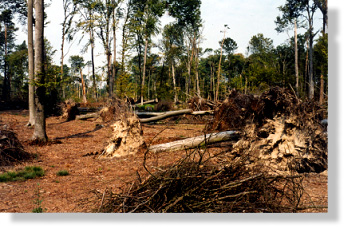
The storms that left a trail of destruction through France in December 1999 took a devastating human and economic toll. Following initial emergency response, maps and statistical data had to be produced rapidly to assess the extent of the damage. To this end, large volumes of Earth observation data including SPOT imagery and aerial photographs were combined with field surveys. Simulated SPOT 5 imagery was also analysed to gauge its ability to aid damage mapping.

Local-scale damage mapping of small parcels of forest currently relies on
analysis of aerial photographs at 1:30 000 and on field surveys by ONF, the
French national forestry service, or by private contractors. Remote sensing
data speeds up assessment, which can be very time-consuming where storm damage
is spread over a vast area. SPOT 5's capacity to acquire timely, accurate
and reliable geographic information covering large tracts of forest is therefore
a precious aid.
![]() Haguenau
forest (Alsace, north-east France)
Haguenau
forest (Alsace, north-east France)
Haguenau forest is France's second largest plain forest, covering 13,472 hectares.
It is some 30 kilometres north of Strasbourg, stretching 30 kilometres east
to west across the Alsace plain and 10 kilometres north to south.

The advantages of SPOT 5 XS imagery Vegetation index variations were calculated
from two simulated SPOT 5 colour images with 10-metre resolution, the first
acquired before the storms (in July 1998) and the second after the storms
(in June 2000).
These variations highlighted:
- Damage zones
- Windthrow clean-up zones
![]() Results
with SPOT 4 and SPOT 5 images closely match those obtained by ONF (to within
around two per cent). The best damage assessments are obtained with SPOT 5
10-metre colour and 2.5-m black-and-white imagery.
Results
with SPOT 4 and SPOT 5 images closely match those obtained by ONF (to within
around two per cent). The best damage assessments are obtained with SPOT 5
10-metre colour and 2.5-m black-and-white imagery.
|
Results obtained with SPOT 4
|
Results obtained with SPOT 5 -
10-m colour |
Results obtained with SPOT 5 -
2.5-m black and white |
ONF reference data
|
|||||
|
Damage class
|
Parcel
area % |
Number
of parcels % |
Parcel
area % |
Number
of parcels % |
Parcel
area % |
Number
of parcels % |
Parcel
area % |
Number
of parcels % |
|
Less than 10%
|
33
|
37
|
31
|
34
|
27
|
31
|
26
|
33
|
|
10 to 40%
|
21
|
21
|
19
|
21
|
26
|
25
|
25
|
26
|
|
40 to 80%
|
22
|
21
|
28
|
26
|
30
|
29
|
31
|
25
|
|
More than 80%
|
24
|
21
|
22
|
19
|
17
|
15
|
18
|
16
|
![]() For
578 forest parcels, results obtained with SPOT 5 compare very well with parcel
damage maps produced by ONF.
For
578 forest parcels, results obtained with SPOT 5 compare very well with parcel
damage maps produced by ONF.
Damage zones can be mapped accurately by comparing 10-metre
colour images acquired by SPOT 5 before and after a storm. Results for forest
parcels are very close to those obtained by ONF, working at a scale of about
1:10 000. In comparison with a similar data set acquired by SPOT 4, detection
errors using SPOT 5 data are reduced by half.
With SPOT 5 2.5-metre black-and-white data, damage can be mapped at a scale
of around 1:3 000. Results show that increased resolution enables much more
accurate damage mapping, with variations of just one per cent with respect
to ONF data.
|
SPOT 5 - A clearer view of forests HRG instrument (High Resolution Geometric) Multi-resolution, wide-swath imaging. A new range of spatial resolutions for forest management :
Wide-area imaging:
|
References:
- ADEMA/CNES programme: advantages of simulated SPOT data and synergies between SPOT 5 and radar coherence data for evaluating storm damage - SERTIT.